
Guides
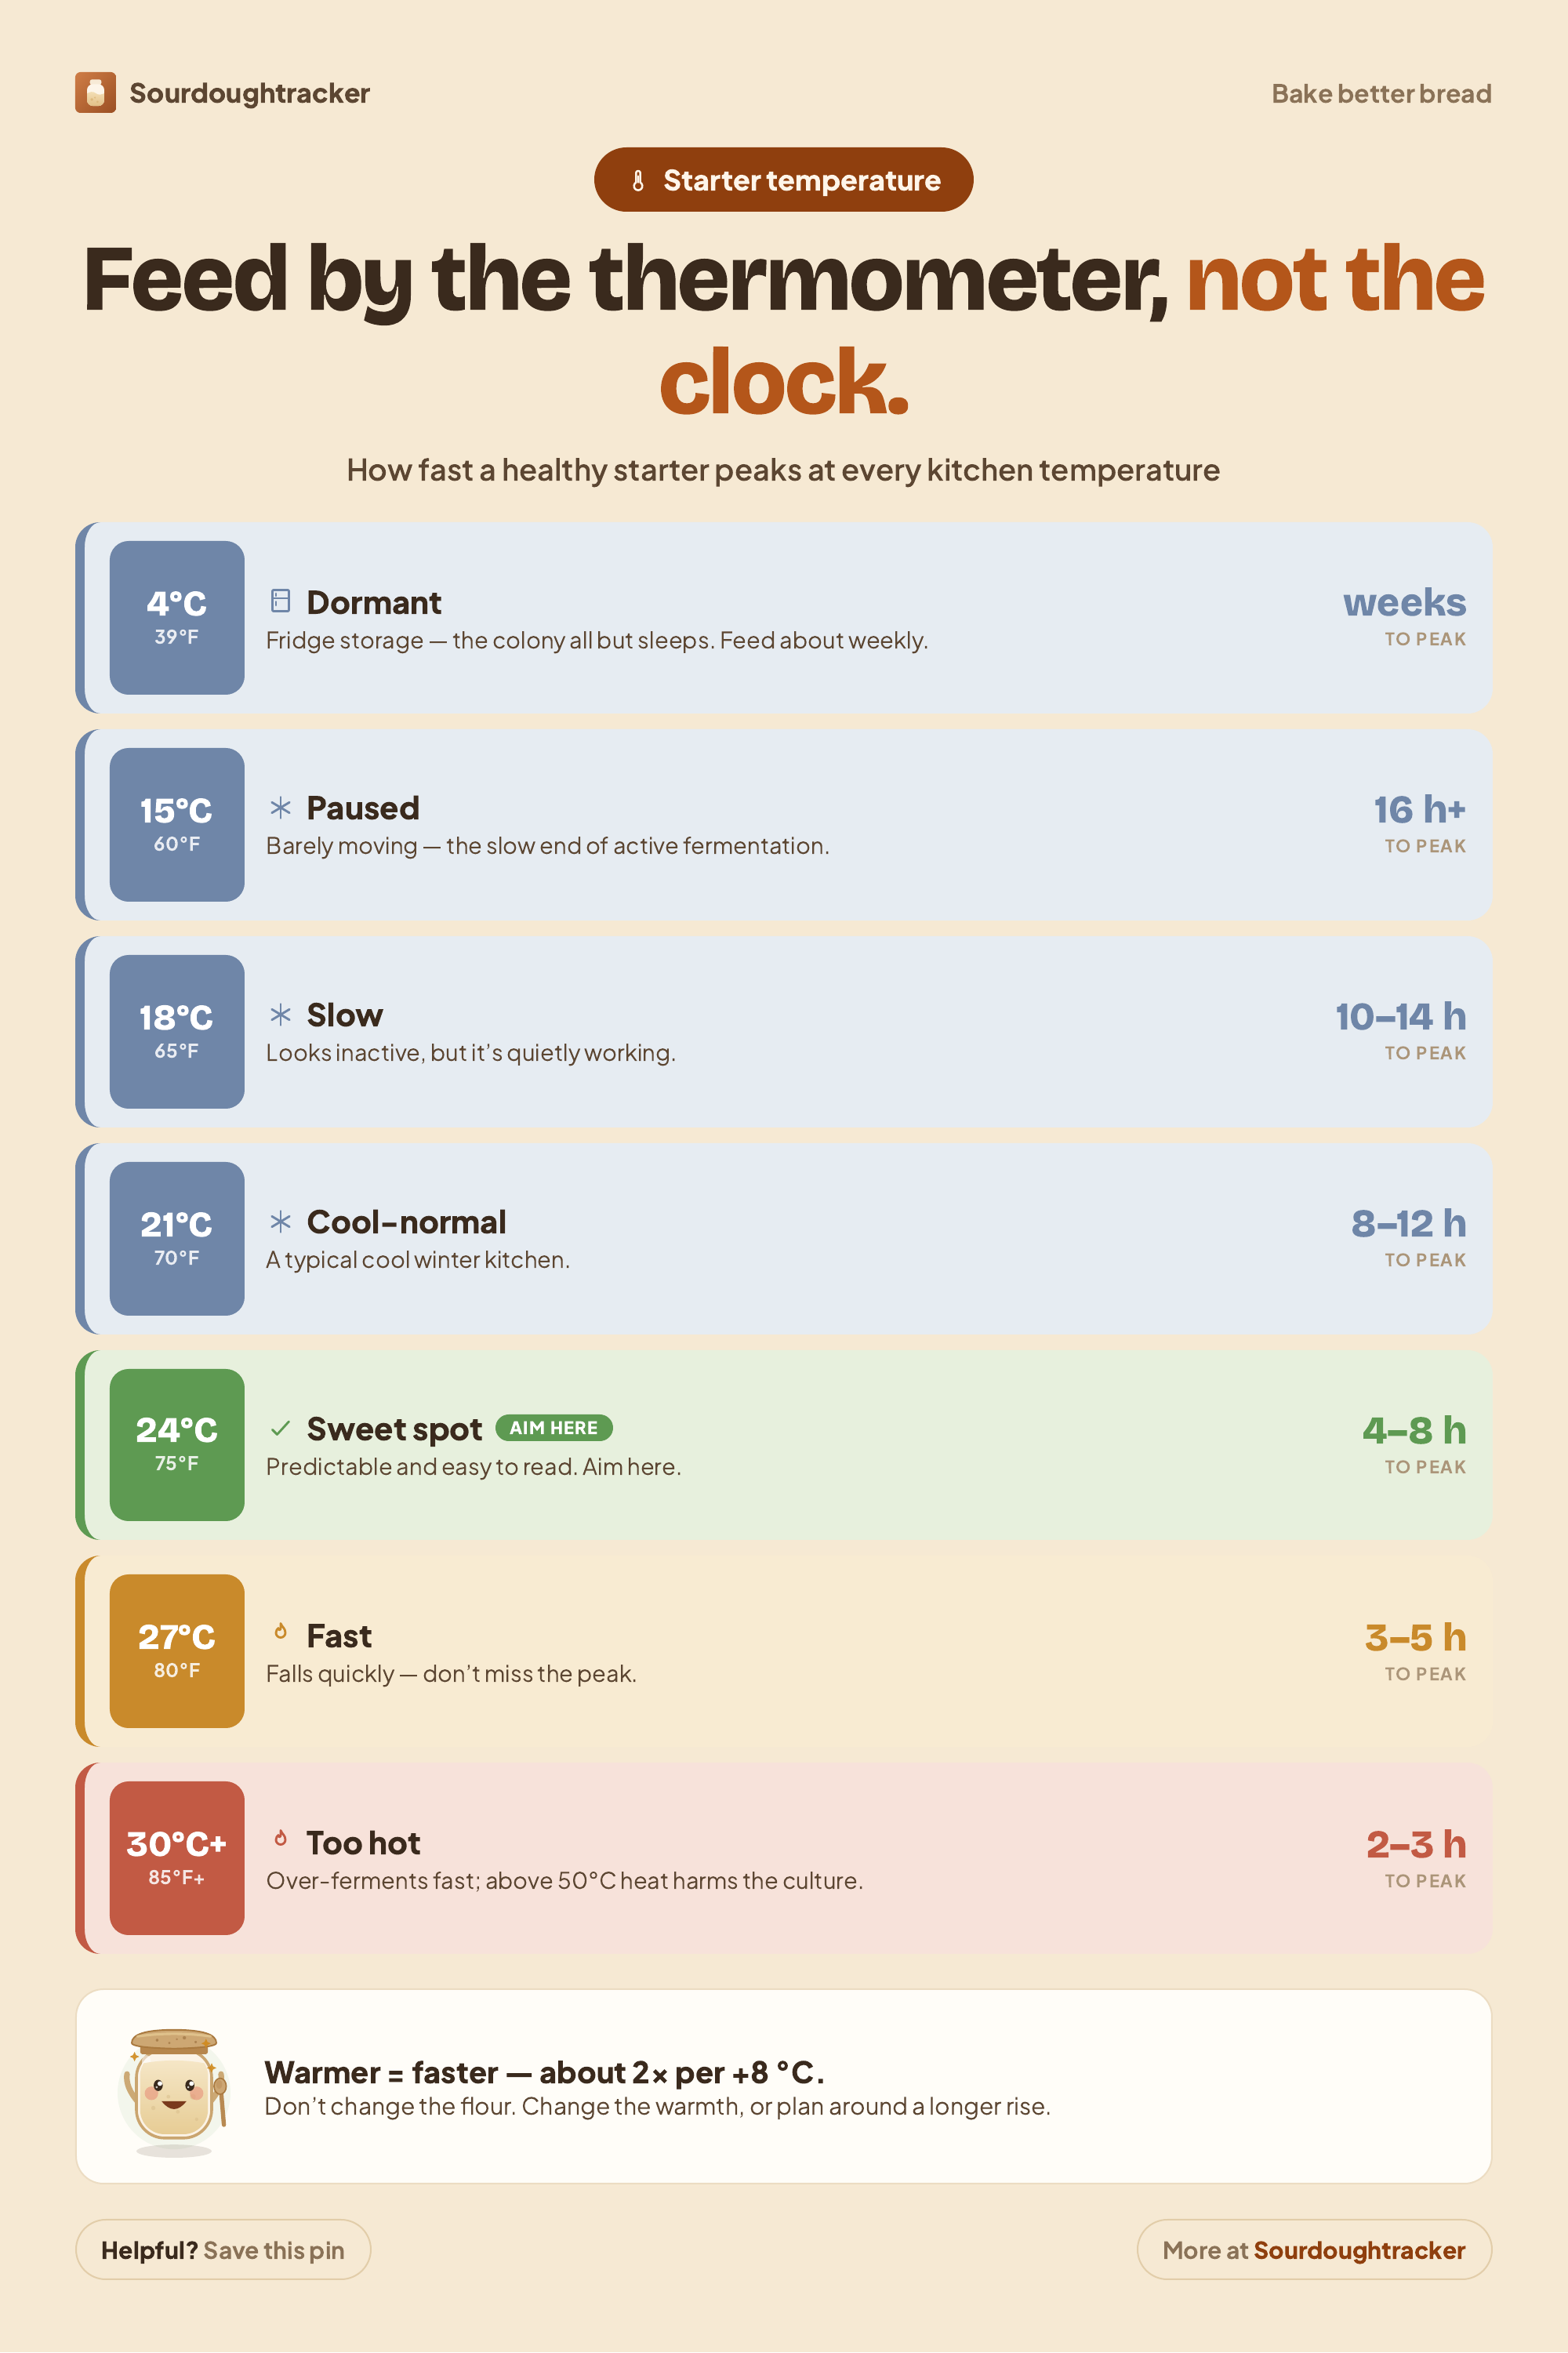
The sourdough temperature chart: what 65, 70, 75 and 80F do to your starter
A reference chart plus a simple routine for adjusting your starter across the seasons, so a cold snap or a heatwave never catches your baking off guard again.

Key takeaways
Measure the actual temperature
Put a thermometer where the starter lives. The room reading often differs from the spot on the counter by a couple of degrees.
Find your number on the chart
Read off the rough time-to-peak so you know what to expect before you blame the starter.
Pick warm-it or wait
Too cold: oven-light box, heat mat, or warmer feed water. Too hot: cooler spot, stronger ratio, or the fridge.
Log temp + time-to-peak
Record both each feed. After a couple of weeks your own curve beats any generic chart.
How to read the chart
These numbers describe roughly how long a healthy, established starter takes to peak (to rise to its maximum and just begin to dome or flatten) after a standard 1:1:1 feed. Treat them as a starting map, not gospel: your flour, your starter's strength and your hydration all nudge the exact timing. The point isn't the precise hour; it's the relationship. Once you internalise that warmer equals faster, you stop trusting recipe clocks blindly and start reading your own jar.
Celsius cheat line
If you think in Celsius: 18C is slow, 24C is the sweet spot, 27C is fast, and anything over 50C is the danger zone. The chart's Fahrenheit milestones map to roughly 18 / 21 / 24 / 27C.
Winter routine: warm it or wait
When the kitchen drops below ~21C, you have two honest options and they're both fine. Option one: give the starter a warmer home (the oven-light box, top of the fridge, a heat mat) so it keeps its summer schedule. Option two: change nothing about warmth and simply expect a longer peak, feeding once a day instead of twice and planning bakes around a 10-hour rise. The mistake is to do neither, keep the summer timing, see a flat jar at hour four, and conclude the starter failed.
Summer routine: cool it or feed more
Heat is the opposite problem and it sneaks up on people too. Above ~27C a starter races, peaks before you're ready, then collapses into a sour, hooch-topped slump if you don't catch it. In a hot kitchen, feed more often or with a stronger ratio (1:5:5 buys you more time before peak), use cooler feed water, and move the jar to the coolest spot you have. If a heatwave makes daily attention impossible, the fridge is your friend: chill it and feed weekly until the weather breaks.
Dough temperature, not just starter: the water trick
The chart so far is about the starter, but the same physics rule your dough, and bakers use one simple lever to hit a target dough temperature: the water. Most recipes assume a dough temperature around 75 to 78F / 24 to 26C coming out of the mix, which keeps the bulk ferment on the schedule the recipe was written for. In a cold kitchen, warmer water nudges the dough up into that band; in a hot one, cooler (even fridge-cold) water pulls it down. A rough working rule many bakers keep in their head: aim the water a little warmer than the room in winter and cooler than the room in summer, then check the finished dough with a probe thermometer and adjust next time.
Two safety rails matter. Keep feed and dough water comfortably warm, never hot: above roughly 40C / 104F you start stressing the yeast, and around 50C / 120F and up you cook the culture outright. And remember the dough makes its own heat as it ferments and as you knead, so a dough that starts at 26C can drift warmer over a long bulk. When the timing of a bake keeps surprising you, it is almost always temperature, not technique, and a quick read settles it.
How to warm a cold starter (and cool a hot one): the actual methods
No-equipment first, then the gear, ranked by how much control they give.
You almost never need to buy anything to fix a temperature problem. Reach for the free options first and only add gear if your kitchen swings hard between seasons.
Let the chart adjust itself: log temperature with every feed
A printed chart is a great starting point, but your real chart is the one your own kitchen writes. If you note the room temperature and the time-to-peak each feed, within two weeks you have a personal curve far more accurate than any generic table, because it bakes in your flour, your jar and your home. Sourdough Tracker is built to keep exactly this thread, and its feed reminders shift with your starter's actual pace instead of a fixed alarm, so the seasonal slowdown never sneaks up on you. Pair this with reading your rise percentage and you can predict your peak window to the hour.
Infographic: feed by temperature
The whole chart on one page. Tap it to download, or pin it for your next bake.
 Download
FAQ
Frequently asked
Try Sourdough Tracker
Free plan, no credit card. We host in Germany. You can export and delete everything self-serve.
Read next
Cold kitchen? How temperature silently slows your sourdough starter (and how to fix it)
Temperature is the #1 reason a starter looks dead. Here is what each degree does, and how to fix a cold kitchen.
Read
Put your sourdough starter to sleep in the fridge (and wake it back up)
Intentional fridge dormancy, then a reliable wake-up routine.
Read
7 Signs Your Sourdough Starter Is Ready to Bake - Don't Miss #4
Seven reliable signs your starter is at peak - ranked by how much they actually matter.
Read